
Introduction
Trend lines are one of the most effective and widely used tools in Forex trading. Despite the growing number of indicators available on modern trading platforms, many professional traders still rely heavily on trend lines because they provide a simple and clear view of market direction.
Understanding how to use trend lines in Forex can help traders identify trends, locate high-probability entry points, manage risk, and improve overall trading performance. Whether you trade major currency pairs such as EUR/USD, GBP/USD, or USD/JPY, trend lines can become a valuable part of your trading strategy.
Unlike complex indicators that may lag behind price action, trend lines are drawn directly on the chart and help traders analyze market structure in real time.
If you want to practice trend line trading in live market conditions, you can open an account here: https://affiliate.iqoption.net/redir/?aff=386290&aff_model=revenue&afftrack=blog
What Are Trend Lines?
A trend line is a straight line drawn on a chart that connects important price points. The purpose of a trend line is to help traders identify the direction of the market and potential areas where price may react.
There are two primary types of trend lines:
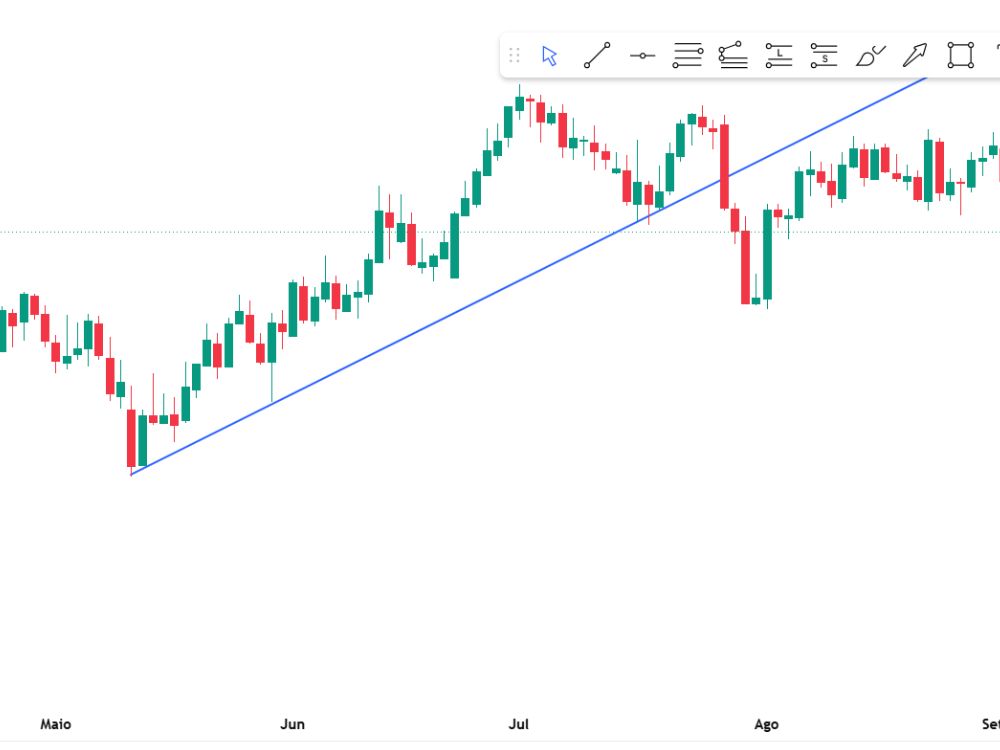
Uptrend Lines
An uptrend line connects a series of higher lows.
When buyers are in control, the market tends to create higher lows over time. Connecting these lows forms an upward trend line that often acts as dynamic support.
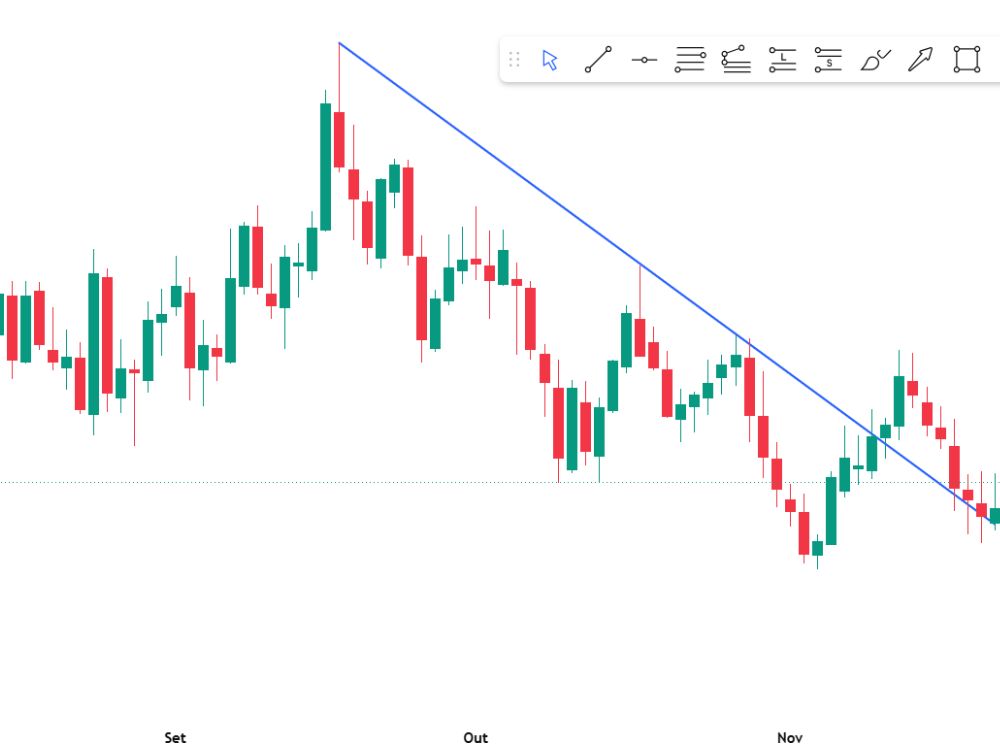
Downtrend Lines
A downtrend line connects a series of lower highs.
When sellers dominate the market, price creates lower highs. Connecting these highs forms a downward trend line that often acts as dynamic resistance.
The more times a trend line is respected by price, the more significant it becomes.
Why Trend Lines Matter in Forex Trading
Many traders focus only on indicators and forget that price action itself provides valuable information. Trend lines help simplify chart analysis by showing the market’s overall direction.
Key benefits include:
Identifying Market Trends
Trend lines quickly reveal whether the market is bullish, bearish, or ranging.
Finding Entry Opportunities
When price approaches a well-established trend line, traders often look for potential entries in the direction of the trend.
Locating Support and Resistance
Trend lines can act as dynamic support and resistance levels, helping traders anticipate market reactions.
Improving Risk Management
Trend lines help traders define logical stop-loss and take-profit levels.
For these reasons, trend lines remain one of the most reliable tools in technical analysis.
How to Draw Trend Lines Correctly
Drawing trend lines properly is essential for accurate market analysis.
Step 1: Identify Major Swing Points
Look for clear highs and lows on the chart.
For an uptrend:
- Connect at least two higher lows.
For a downtrend:
- Connect at least two lower highs.
Step 2: Focus on Significant Price Movements
Avoid forcing a trend line to fit every candle.
Instead, focus on major turning points where the market clearly reacted.
Step 3: Look for Multiple Touches
A trend line becomes stronger when price respects it multiple times.
Three or more touches often indicate a meaningful trend line.
Step 4: Use Higher Time Frames
Trend lines drawn on the 4-hour and daily charts tend to be more reliable than those drawn on lower time frames.
How to Use Trend Lines in Forex Trading
Once a trend line is established, traders can use it in several ways.
Trend Line Bounce Strategy
One of the most popular approaches is trading trend line bounces.
Example of an Uptrend Trade
Imagine EUR/USD is in a strong uptrend.
Price pulls back toward the trend line after making a higher high.
As price approaches the trend line, a bullish candlestick pattern forms.
A trader may enter a buy position expecting the trend to continue.
Example of a Downtrend Trade
Suppose GBP/USD is trending lower.
Price retraces toward a downtrend line and forms a bearish rejection candle.
A trader may enter a sell position expecting sellers to regain control.
This strategy allows traders to trade with the trend rather than against it.
If you want to test this strategy in real market conditions, you can open an account here: https://affiliate.iqoption.net/redir/?aff=386290&aff_model=revenue&afftrack=blog
Trend Line Breakout Trading
Trend lines are not only useful for following trends. They can also help identify potential trend reversals.
Bullish Breakout
When price breaks above a downtrend line, it may signal that buyers are taking control.
Bearish Breakout
When price breaks below an uptrend line, it may indicate growing selling pressure.
However, traders should avoid entering immediately after every breakout.
Instead, wait for confirmation such as:
- Strong momentum candles
- Increased volume
- Retest of the broken trend line
- Confirmation from support or resistance zones
This reduces the risk of false breakouts.
Common Trend Line Mistakes
Many traders misuse trend lines and reduce their effectiveness.
Drawing Trend Lines Through Candle Bodies
Trend lines generally work best when connecting swing highs and swing lows rather than forcing lines through random candles.
Trading Every Touch
Not every trend line touch leads to a profitable trade.
Always wait for confirmation before entering a position.
Ignoring Market Context
Trend lines should be analyzed alongside overall market structure, support and resistance levels, and economic news.
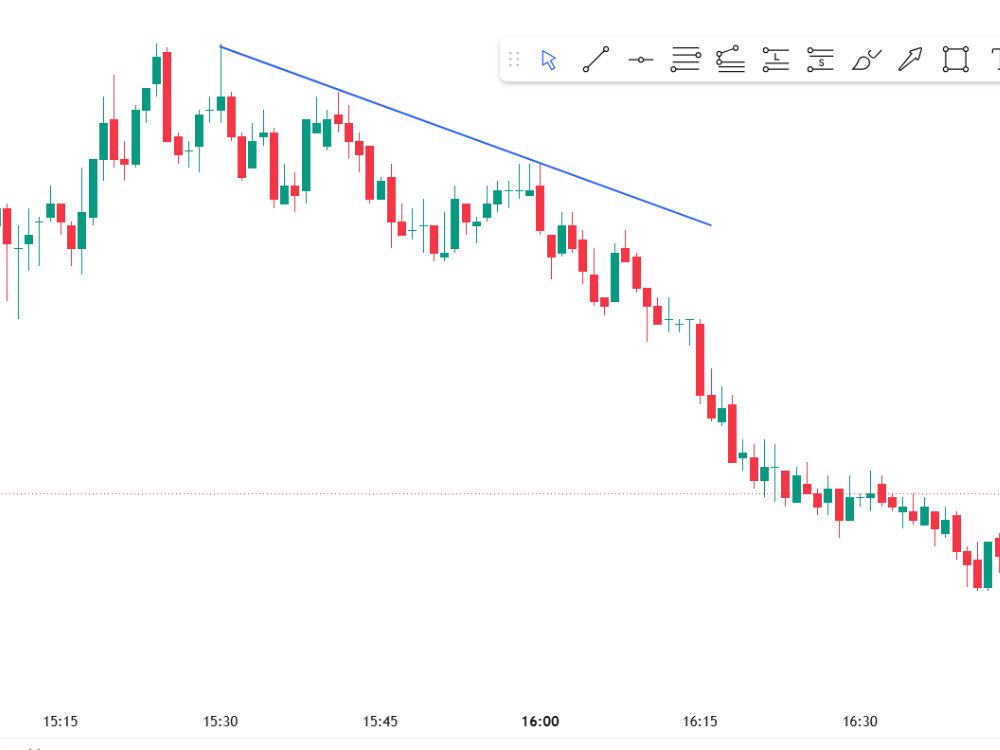
Using Extremely Short Time Frames
Trend lines on 1-minute and 5-minute charts often produce more false signals.
Higher time frames usually provide stronger setups.
Advanced Tips for Trend Line Trading
Once you understand the basics, you can combine trend lines with other technical tools.
Combine Trend Lines with Support and Resistance
A trend line that aligns with a major support or resistance level creates a stronger trading opportunity.
Use Price Action Confirmation
Candlestick patterns such as:
- Pin Bars
- Engulfing Candles
- Inside Bars
can provide additional confirmation for trend line setups.
Monitor Multiple Time Frames
Many professional traders analyze daily, 4-hour, and 1-hour charts simultaneously.
This approach helps identify stronger market trends and better trading opportunities.
Risk Management When Trading Trend Lines
Risk management is essential for long-term trading success.
Set Logical Stop Losses
For buy trades:
Place the stop loss below the trend line and recent swing low.
For sell trades:
Place the stop loss above the trend line and recent swing high.
Maintain a Positive Risk-to-Reward Ratio
A common goal is a minimum risk-to-reward ratio of 1:2.
For example:
- Risk: 50 pips
- Target: 100 pips
This allows traders to remain profitable even if some trades lose.
Never Risk Too Much on One Trade
Many experienced traders risk only 1% to 2% of their account balance per trade.
This helps protect capital during losing streaks.
Conclusion
Learning how to use trend lines in Forex trading can dramatically improve your ability to identify trends, locate entry points, and manage risk effectively.
Trend lines are simple, versatile, and suitable for both beginner and advanced traders. When combined with support and resistance, price action analysis, and proper risk management, they become a powerful tool for navigating the Forex market.
The key to success is consistency. Practice drawing trend lines on historical charts, test your strategy in different market conditions, and focus on disciplined execution.
If you’re ready to apply trend line strategies in live Forex markets, you can get started here: https://affiliate.iqoption.net/redir/?aff=386290&aff_model=revenue&afftrack=blog
Remember that successful trading is not about predicting every market move. It is about managing risk, following a proven strategy, and maintaining discipline over the long term.