
What Is Support and Resistance in Forex?
Support and resistance are among the most powerful concepts in Forex trading. Every day, traders around the world use these levels to identify potential entries, exits, and market reversals.
Support is a price area where buying pressure becomes strong enough to stop a decline. Resistance is a price area where selling pressure becomes strong enough to stop an advance.
These levels exist because traders tend to react similarly when price reaches certain areas. Understanding where these reactions are likely to occur can help improve your trading decisions and overall consistency.
Whether you trade major currency pairs, minor pairs, or exotic currencies, support and resistance can provide valuable insight into market behavior.
Start Practicing on Real Charts
Learning support and resistance becomes much easier when you can see these levels forming on live market charts. Many successful traders begin by practicing on a demo account before moving to real-money trading.
https://affiliate.iqoption.net/redir/?aff=386290&aff_model=revenue&afftrack=blog
Why Support and Resistance Matter
The Forex market is driven by supply and demand. When buyers outnumber sellers, prices rise. When sellers outnumber buyers, prices fall.
Support and resistance help traders identify areas where these shifts in market sentiment are likely to occur.
Benefits include:
- Better entry points
- Improved exit decisions
- More accurate stop-loss placement
- Higher-quality trade setups
- Improved risk management
Because these levels are watched by both retail traders and institutions, they often become self-fulfilling areas of market reaction.
How to Identify Support Levels
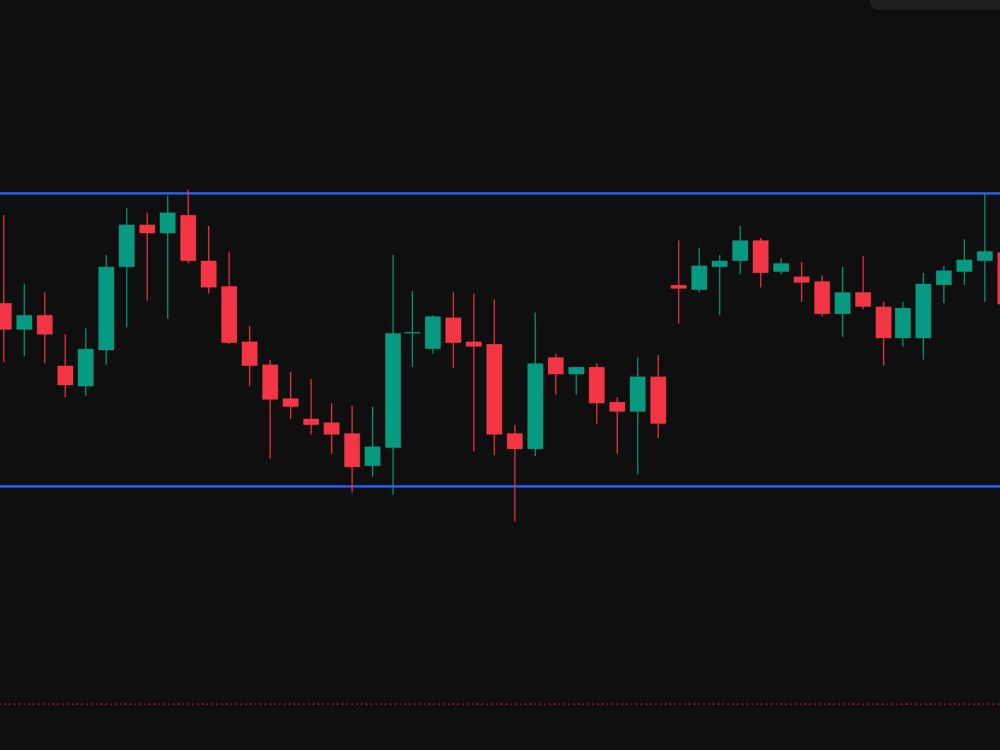
Support forms when buyers consistently enter the market at a specific price area.
To identify support:
- Open a Forex chart.
- Look for previous lows where price bounced upward.
- Draw a horizontal line connecting those lows.
- Monitor future reactions around that area.
For example, if EUR/USD repeatedly bounces near the same price level, traders recognize it as a support zone.
Generally, support becomes stronger each time price respects the level without breaking below it.
How to Identify Resistance Levels
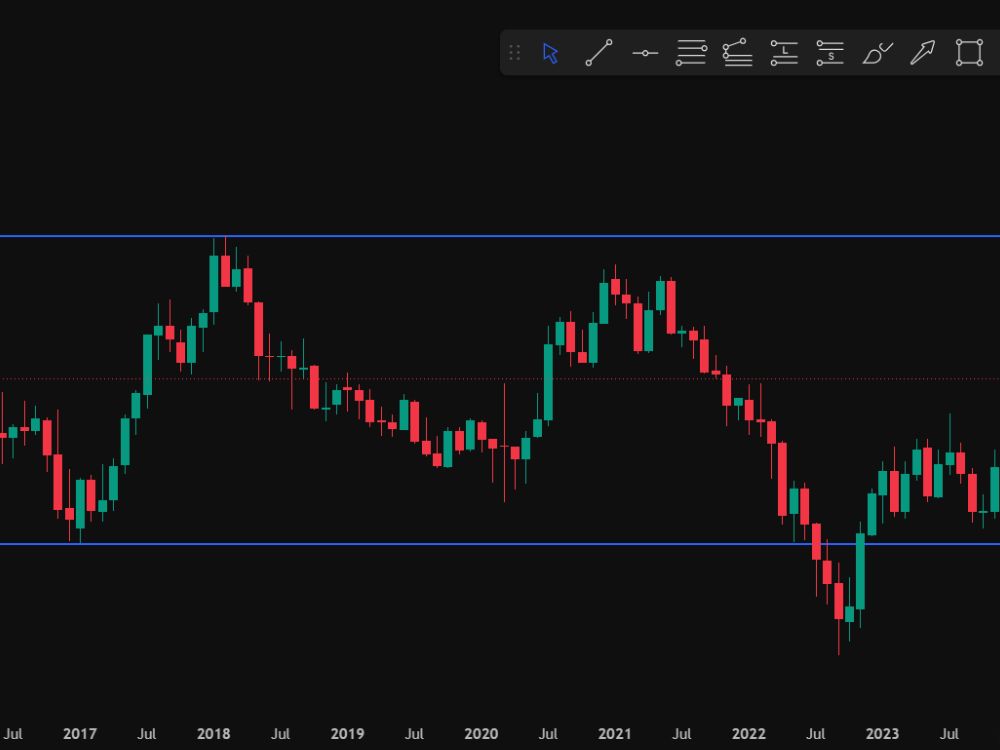
Resistance is the opposite of support.
A resistance level forms when sellers consistently enter the market and prevent prices from moving higher.
To identify resistance:
- Locate previous swing highs.
- Draw a horizontal line across those highs.
- Watch future price reactions.
When price repeatedly struggles to break above the same area, resistance becomes increasingly significant.
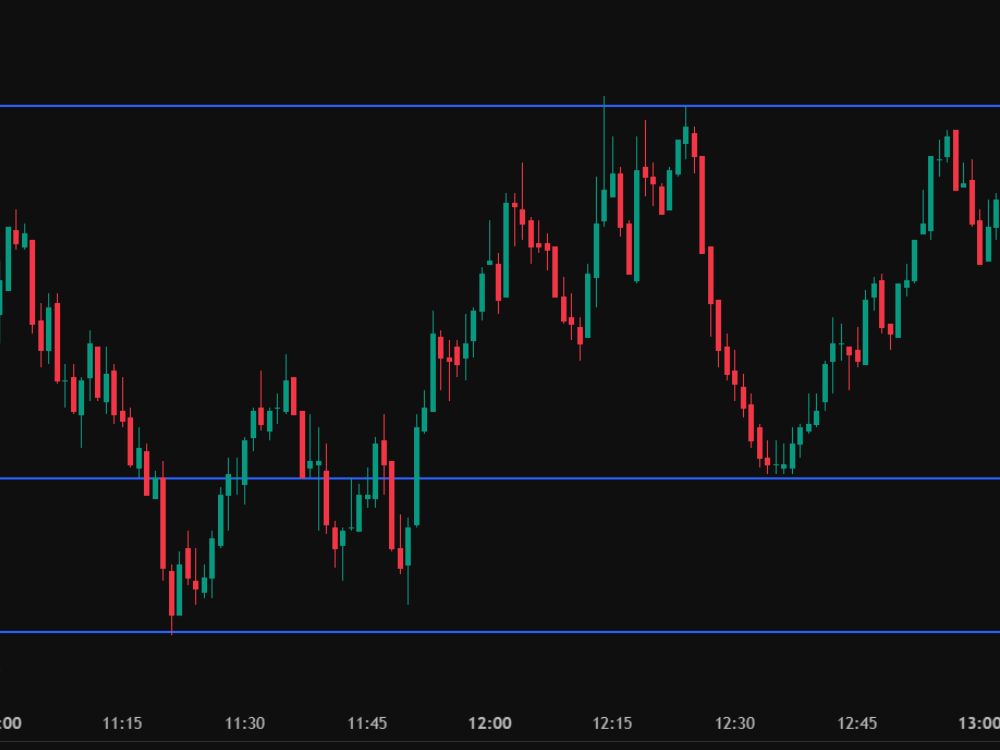
Support and Resistance Are Zones
One of the biggest mistakes beginner traders make is treating support and resistance as exact numbers.
Professional traders understand that these are zones rather than precise lines.
Price often moves slightly above resistance or below support before reversing direction.
This happens because market participants place orders at slightly different prices.
Instead of focusing on a single level, consider support and resistance as areas where buying or selling activity is likely to increase.
Trading Support and Resistance Reversals
One of the most common Forex strategies involves trading reversals from support and resistance zones.
Buying at Support
When price reaches support and begins showing signs of strength, traders may look for buying opportunities.
Common confirmation signals include:
- Bullish engulfing patterns
- Pin bars
- Long rejection wicks
- Strong bullish candles
The objective is to buy near support and benefit from a potential upward move.
Selling at Resistance
When price reaches resistance and starts showing weakness, traders may look for selling opportunities.
Popular confirmation signals include:
- Bearish engulfing patterns
- Shooting stars
- Rejection candles
- Declining momentum
The goal is to sell near resistance and profit from a potential decline.
Put These Concepts into Practice
Understanding support and resistance is important, but practical experience is what helps traders improve. Applying these concepts on live charts allows you to recognize patterns faster and develop confidence in your analysis.
https://affiliate.iqoption.net/redir/?aff=386290&aff_model=revenue&afftrack=blog
Trading Breakouts
Support and resistance do not last forever.
Eventually, strong buying or selling pressure can push price beyond these levels.
This creates breakout opportunities.
Bullish Breakouts
A bullish breakout occurs when price closes decisively above resistance.
This often signals that buyers have gained control of the market.
Many traders wait for:
- A strong breakout candle
- Increased momentum
- A retest of the broken resistance level
If resistance becomes support, it can create an attractive entry opportunity.
Bearish Breakouts
A bearish breakout occurs when price closes below support.
This suggests sellers have taken control and lower prices may follow.
As with bullish breakouts, traders often wait for confirmation before entering a trade.
Combining Support and Resistance with Other Tools
Support and resistance become even more effective when combined with additional technical analysis tools.
Moving Averages
Moving averages help traders identify the overall trend and can also act as dynamic support and resistance.
Relative Strength Index (RSI)
RSI helps identify overbought and oversold conditions near important levels.
Fibonacci Retracement
Many traders use Fibonacci levels because they frequently align with support and resistance zones.
Candlestick Patterns
Candlestick analysis provides confirmation and can help improve trade timing.
Combining multiple forms of analysis can significantly increase the quality of trading decisions.
Risk Management Using Support and Resistance
Even the strongest levels can fail.
This is why risk management is essential.
For buy trades:
- Place stop-loss orders below support.
For sell trades:
- Place stop-loss orders above resistance.
Using support and resistance for stop placement helps protect capital while giving trades enough room to develop.
Professional traders focus on preserving capital first and generating profits second.
Common Mistakes to Avoid
Many traders struggle because they make avoidable errors.
Some of the most common include:
- Trading without confirmation
- Ignoring the trend
- Drawing too many levels
- Risking too much on a single trade
- Letting emotions influence decisions
Keeping your analysis simple often produces better results than creating overly complicated charts.
Conclusion
Support and resistance are foundational concepts that every Forex trader should learn. These levels help identify where buyers and sellers are likely to become active, providing valuable information for entries, exits, and risk management.
By learning how to identify support and resistance zones, trade reversals, recognize breakouts, and manage risk effectively, traders can improve their overall market analysis and decision-making.
Like any trading skill, mastering support and resistance requires practice, patience, and discipline. The more charts you analyze, the easier it becomes to recognize high-probability setups and avoid poor trades.
Ready to Start Trading?
Now that you understand how support and resistance work, the next step is applying these concepts in real market conditions. Open a demo account, practice identifying key levels, and start building your trading experience today.
https://affiliate.iqoption.net/redir/?aff=386290&aff_model=revenue&afftrack=blog