Learn how to use Fibonacci retracement in Forex trading to identify support and resistance levels, improve trade entries, and manage risk more effectively.
Forex traders use many technical analysis tools to find trading opportunities, but few are as popular as Fibonacci retracement. This simple yet powerful tool helps traders identify potential support and resistance levels where price may reverse or continue moving in the direction of the trend.
If you are new to Forex trading, understanding how Fibonacci retracement works can improve your market analysis and help you make more confident trading decisions. In this guide, you will learn what Fibonacci retracement is, how to draw it correctly, and how to use it in practical Forex trading situations.
What Is Fibonacci Retracement?
Fibonacci retracement is a technical analysis tool used to identify potential price levels where a market may pull back before continuing its trend.
The tool is based on the Fibonacci sequence, a mathematical pattern discovered by Leonardo Fibonacci. From this sequence, several ratios are derived that traders use in financial markets.
The most common Fibonacci retracement levels are:
- 23.6%
- 38.2%
- 50%
- 61.8%
- 78.6%
These levels are automatically displayed when using the Fibonacci retracement tool on platforms such as MetaTrader 4, MetaTrader 5, and TradingView.
The main idea is simple: after a strong price movement, markets often retrace a portion of that move before continuing in the original direction. Fibonacci levels help traders estimate where those pullbacks may end.
Traders often use Fibonacci retracement levels to identify potential reversal zones. If you’d like to practice these setups in real market conditions, you can open a demo account with IQ Option. https://affiliate.iqoption.net/redir/?aff=386290&aff_model=revenue&afftrack=blog
Why Fibonacci Retracement Works in Forex
The Forex market moves in waves. Even during strong trends, prices rarely move straight up or straight down.
For example, EUR/USD may rise significantly during a bullish trend. Before continuing higher, the pair may temporarily move lower as traders take profits and new participants enter the market.
These pullbacks create opportunities for traders looking to join the trend at a better price.
Because thousands of traders monitor Fibonacci levels, these areas often become important support and resistance zones. While Fibonacci levels do not guarantee reversals, they frequently attract market attention and can help traders identify high-probability setups.
How to Draw Fibonacci Retracement Correctly
Correct placement is essential for accurate analysis.
In an Uptrend
When the market is moving higher:
- Identify a significant swing low.
- Identify a significant swing high.
- Draw the Fibonacci tool from the low to the high.
The retracement levels will appear below the current price and may act as support.
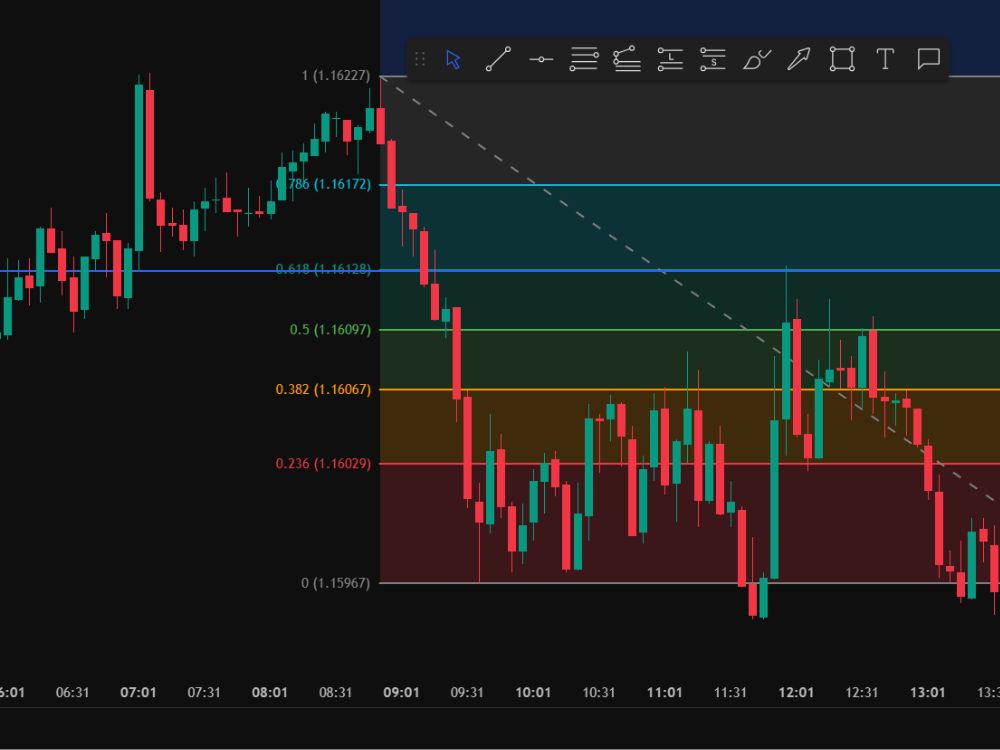
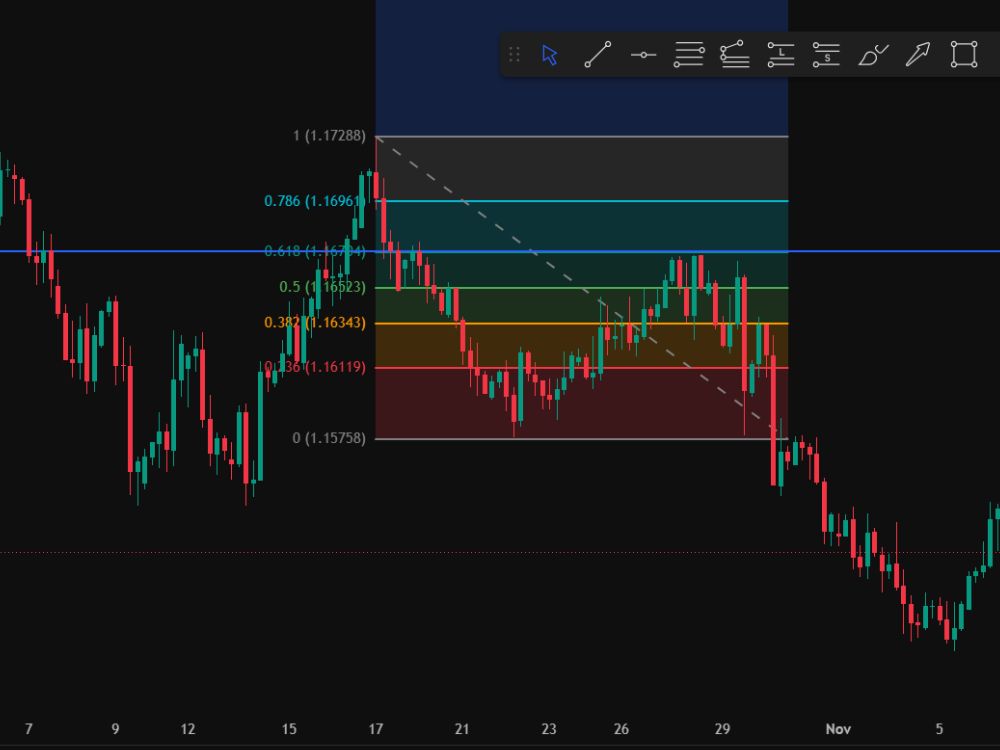
In a Downtrend
When the market is moving lower:
- Identify a significant swing high.
- Identify a significant swing low.
- Draw the Fibonacci tool from the high to the low.
The retracement levels will appear above the current price and may act as resistance.
A common mistake among beginners is drawing Fibonacci between minor price movements. Focus on clear swing highs and swing lows that stand out on the chart.
Understanding the Key Fibonacci Levels
38.2% Retracement
The 38.2% level is often seen during strong trends. If price only retraces to this level before continuing, it suggests that buyers or sellers remain in control.
50% Retracement
Although 50% is not an official Fibonacci ratio, it is widely respected by traders. Markets often retrace about half of a previous move before resuming the trend.
61.8% Retracement
The 61.8% level is considered the most important Fibonacci retracement level. Many professional traders look for trade opportunities around this area because it often acts as strong support or resistance.
78.6% Retracement
This is a deeper retracement level. If price reaches this area and shows signs of reversal, the trend may still remain intact.
These Fibonacci levels can be easily plotted on most trading platforms, including IQ Option’s charting interface. https://affiliate.iqoption.net/redir/?aff=386290&aff_model=revenue&afftrack=blog
A Simple Fibonacci Forex Trading Strategy
One of the easiest ways to use Fibonacci retracement is with trend trading.
Step 1: Identify the Trend
First, determine whether the market is trending up or down.
An uptrend consists of higher highs and higher lows.
A downtrend consists of lower highs and lower lows.
Step 2: Draw Fibonacci Retracement
Apply the Fibonacci tool to the most recent swing.
In an uptrend, draw from low to high.
In a downtrend, draw from high to low.
Step 3: Wait for a Pullback
Instead of chasing the market, wait for price to retrace toward a key Fibonacci level.
Many traders focus on the 38.2%, 50%, and 61.8% levels.
Step 4: Look for Confirmation
Do not enter a trade simply because price reaches a Fibonacci level.
Look for confirmation such as:
- Bullish engulfing candles
- Bearish engulfing candles
- Pin bars
- Strong rejection candles
- Breaks of minor trendlines
Confirmation helps reduce false signals.
Step 5: Manage Risk
Place a stop-loss beyond the recent swing point and ensure the potential reward is greater than the risk.
Many successful traders aim for a minimum risk-to-reward ratio of 1:2.
Combining Fibonacci with Support and Resistance
Fibonacci retracement becomes even more powerful when combined with support and resistance levels.
For example, imagine that EUR/USD retraces to the 61.8% Fibonacci level while also reaching a previous support zone.
This creates what traders call confluence.
When multiple technical factors point to the same price area, the probability of a market reaction may increase.
This is why many professional traders avoid using Fibonacci alone and instead combine it with other forms of technical analysis.
Common Mistakes Traders Make
Trading Against the Trend
Fibonacci works best when used with the prevailing market trend.
Trying to buy in a strong downtrend or sell in a strong uptrend can lead to unnecessary losses.
Ignoring Price Action
A Fibonacci level is not a guaranteed reversal point.
Always look for evidence that buyers or sellers are entering the market.
Using Too Many Indicators
Some traders clutter their charts with indicators and create confusion.
A clean chart with Fibonacci, support and resistance, and price action is often more effective.
Poor Risk Management
Even the best setup can fail.
Never risk more than a small percentage of your trading account on a single trade.
Protecting your capital is more important than finding the perfect entry.
Conclusion
Fibonacci retracement remains one of the most useful tools in Forex trading because it helps traders identify potential support and resistance levels during trending markets. By understanding how to draw Fibonacci correctly and combining it with price action and trend analysis, traders can improve their entries and manage risk more effectively.
The most widely used Fibonacci retracement levels are 38.2%, 50%, and 61.8%. These levels often attract significant market attention and can provide valuable trading opportunities.
Among them, the 61.8% retracement level is generally considered the most important and most widely respected by Forex traders. Often referred to as the “Golden Ratio,” this level frequently acts as a key support or resistance zone where price may reverse or continue the prevailing trend.
Like any technical tool, Fibonacci retracement should not be used alone. Combining it with market structure, price action, and proper risk management can help traders make better trading decisions and improve their overall consistency in the Forex market.
If you’re ready to practice Fibonacci retracement strategies in real market conditions, you can start with a demo account and explore the platform here. https://affiliate.iqoption.net/redir/?aff=386290&aff_model=revenue&afftrack=blog