Price action trading is one of the most powerful and widely used approaches in financial markets. It is based on the idea of analyzing how price moves directly on the chart, without relying heavily on indicator
Many beginners start practicing with a 10k demo account, which allows them to study real market behavior without risking real money. This helps traders understand price movement in a safe environment.
👉 Open your 10k demo account here: https://affiliate.iqoption.net/redir/?aff=386290&aff_model=revenue&afftrack=blog
In this guide, you will understand what price action is, how it works, and how traders use it across different financial markets such as forex, stocks, indices, commodities, and cryptocurrencies.
What Is Price Action?
Price action is the study of how an asset’s price moves over time without relying heavily on indicators.
Instead of using lagging tools, price action traders focus on:
- Candlestick behavior
- Market structure
- Support and resistance levels
- Trend direction
- Liquidity zones
In simple terms:
👉 Price action is the analysis of raw price movement to make trading decisions.
Every movement on the chart reflects the battle between buyers and sellers.
Why Price Action Is Important
Price action is important because it shows the real behavior of the market.
1. It removes lagging indicators
Indicators often react late. Price action shows what is happening now.
2. It works in
It can be applied to stocks, crypto, indices, commodities, and currencies.
3. It improves decision-making
Traders learn when to enter, exit, or stay out of the market.
4. It simplifies trading
Instead of overloading charts, traders focus on clean price movement.
How Price Action Works in the Market
Price movement is driven by one core principle:
👉 Supply and demand imbalance.
When buyers are stronger, price rises.
When sellers are stronger, price falls.
However, price does not move randomly. It usually follows a cycle:
1. Accumulation
The market moves sideways while large participants build positions.
2. Manipulation
False moves occur to trap retail traders.
3. Expansion
Strong directional movement begins.
This cycle repeats constantly in all financial markets.
Understanding Candlesticks
Candlesticks are the foundation of price action analysis.
Each candle shows:
- Open price
- Close price
- High
- Low
Candlestick Types
Strong bullish candle
Indicates strong buying pressure.
Strong bearish candle
Indicates strong selling pressure.
Doji candle
Represents market indecision.
Long wick
Shows rejection of price levels.
Price action traders read candles as signals of market intent.
Market Structure Explained
Market structure shows the
Uptrend structure:
- Higher highs
- Higher lows
Downtrend structure:
- Lower highs
- Lower lows
Why it matters:
- Identifies trend
- Prevents counter-trend mistakes
- Improves trade probability
Trading with structure is one of the most important principles in price action.
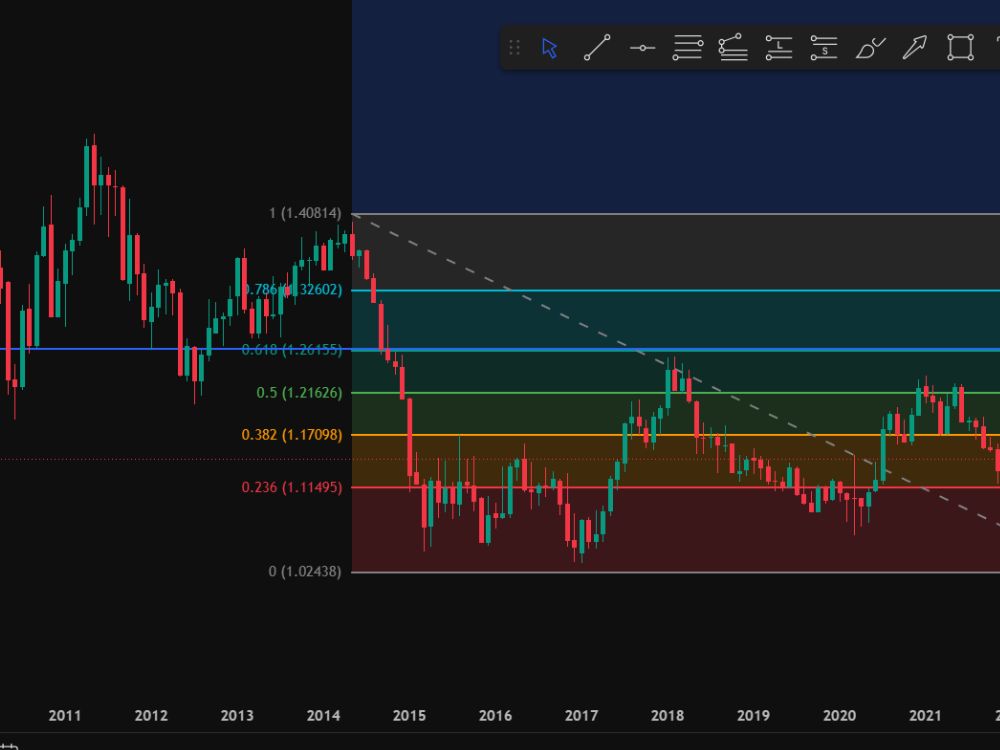
Fibonacci in Price Action Trading
Fibonacci retracement is a popular tool used by price action traders to identify potential pullback levels within a trend.
Even though price action does not depend on indicators, Fibonacci is often used as a supporting confluence tool, not a primary signal.
Traders use Fibonacci levels to find areas where price may react, such as:
- 38.2% retracement
- 50% retracement
- 61.8% retracement
These levels often align with natural market pullbacks during strong trends.
How traders use Fibonacci with price action:
- In an uptrend, traders wait for price to pull back into Fibonacci levels before buying
- In a downtrend, traders wait for retracements before selling
- Fibonacci zones are combined with support and resistance for stronger confirmation
When Fibonacci aligns with market structure and key levels, it increases the probability of high-quality trade setups.
However, traders should never rely on Fibonacci alone. It works best when combined with price action signals like candlestick confirmation and structural support.
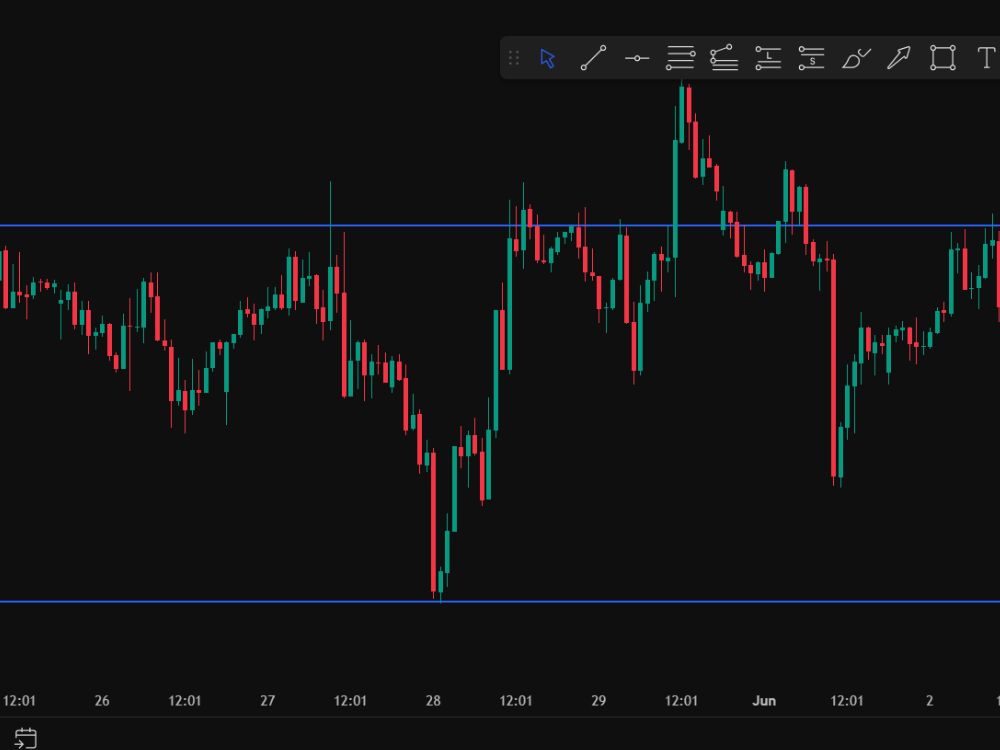
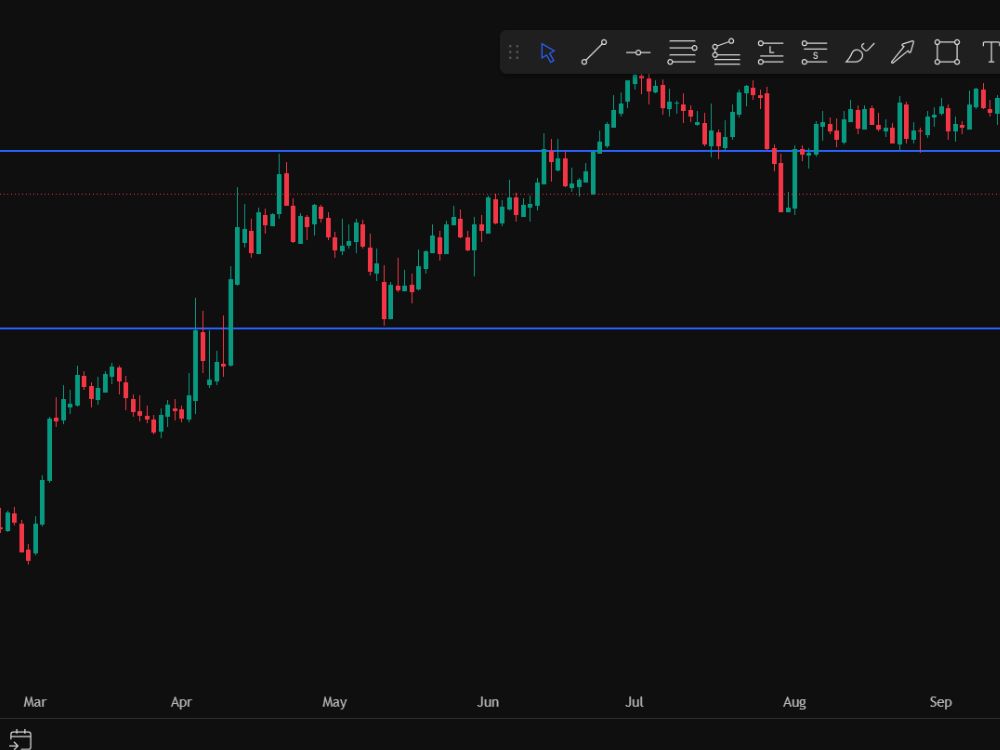
Support and Resistance
Support and resistance are key zones where price reacts.
Support:
A level where price tends to stop falling and reverse upward.
Resistance:
A level where price tends to stop rising and reverse downward.
These levels are important because they represent:
- High liquidity zones
- Institutional interest areas
- Psychological price levels
Price often reacts strongly when it reaches these areas.
Liquidity in Price Action
Liquidity refers to areas where many orders are placed.
Markets often move toward liquidity before reversing or continuing a trend.
This explains:
- Fake breakouts
- Stop-loss hunting
- Sudden reversals
Understanding liquidity helps traders avoid traps and improve timing.
Main Price Action Strategies
1. Breakout Strategy
Price breaks a key level and continues strongly in one direction.
Best used in high volatility conditions.
2. Pullback Strategy
Price retraces before continuing the main trend.
This is one of the safest and most consistent strategies.
3. Range Trading
Used when the market is moving sideways.
Traders buy at support and sell at resistance.
4. Reversal Trading
Traders look for signs that a trend is ending.
Requires confirmation and patience.
Why Use a 10k Demo Account
A 10k demo account is essential for learning price action safely.
Benefits include:
- Risk-free practice
- Real market simulation
- Strategy testing
- Emotional control development
- Learning platform execution
But the most important factor is discipline. Treating demo trading seriously builds real skill.
👉 Start practicing here: https://affiliate.iqoption.net/redir/?aff=386290&aff_model=revenue&afftrack=blog
Emotional Control in Trading
Even with strong analysis, emotions can ruin results.
Common emotional mistakes:
- Fear of missing opportunities
- Overtrading
- Revenge trading
- Closing trades too early
- Ignoring strategy rules
Successful traders follow a system, not emotions.
Risk Management
Risk management is the foundation of long-term success.
Key rules:
- Risk only 1–2% per trade
- Always use stop loss
- Maintain positive risk-reward ratio (1:2 or better)
- Avoid overleveraging
- Protect capital first, profit second
Without risk control, no strategy is sustainable.
Advantages of Price Action Trading
Price action is popular because it is:
- Simple
- Clean
- Flexible
- Universal across markets
- Independent of indicators
It helps traders understand the true behavior of the market.
Common Mistakes Beginners Make
Beginners often fail because they:
- Enter trades without structure
- Ignore trend direction
- Overuse indicators
- Trade emotionally
- Lack patience
- Do not follow risk management
Avoiding these mistakes significantly improves results.
Conclusion
Price action trading is one of the most effective ways to understand financial markets because it focuses on what truly matters: price itself.
Instead of relying on indicators or complex systems, traders learn to read raw market movement and make decisions based on structure, candles, and key levels.
A 10k demo account is the ideal environment to practice and develop this skill before moving to live trading.
👉 Start your journey here: https://affiliate.iqoption.net/redir/?aff=386290&aff_model=revenue&afftrack=blog
Success in trading does not come from prediction, but from understanding what the market is doing in real time and reacting with discipline and consistency.